Demonstration Script
Food Corporation of India — System Walkthrough
FCI
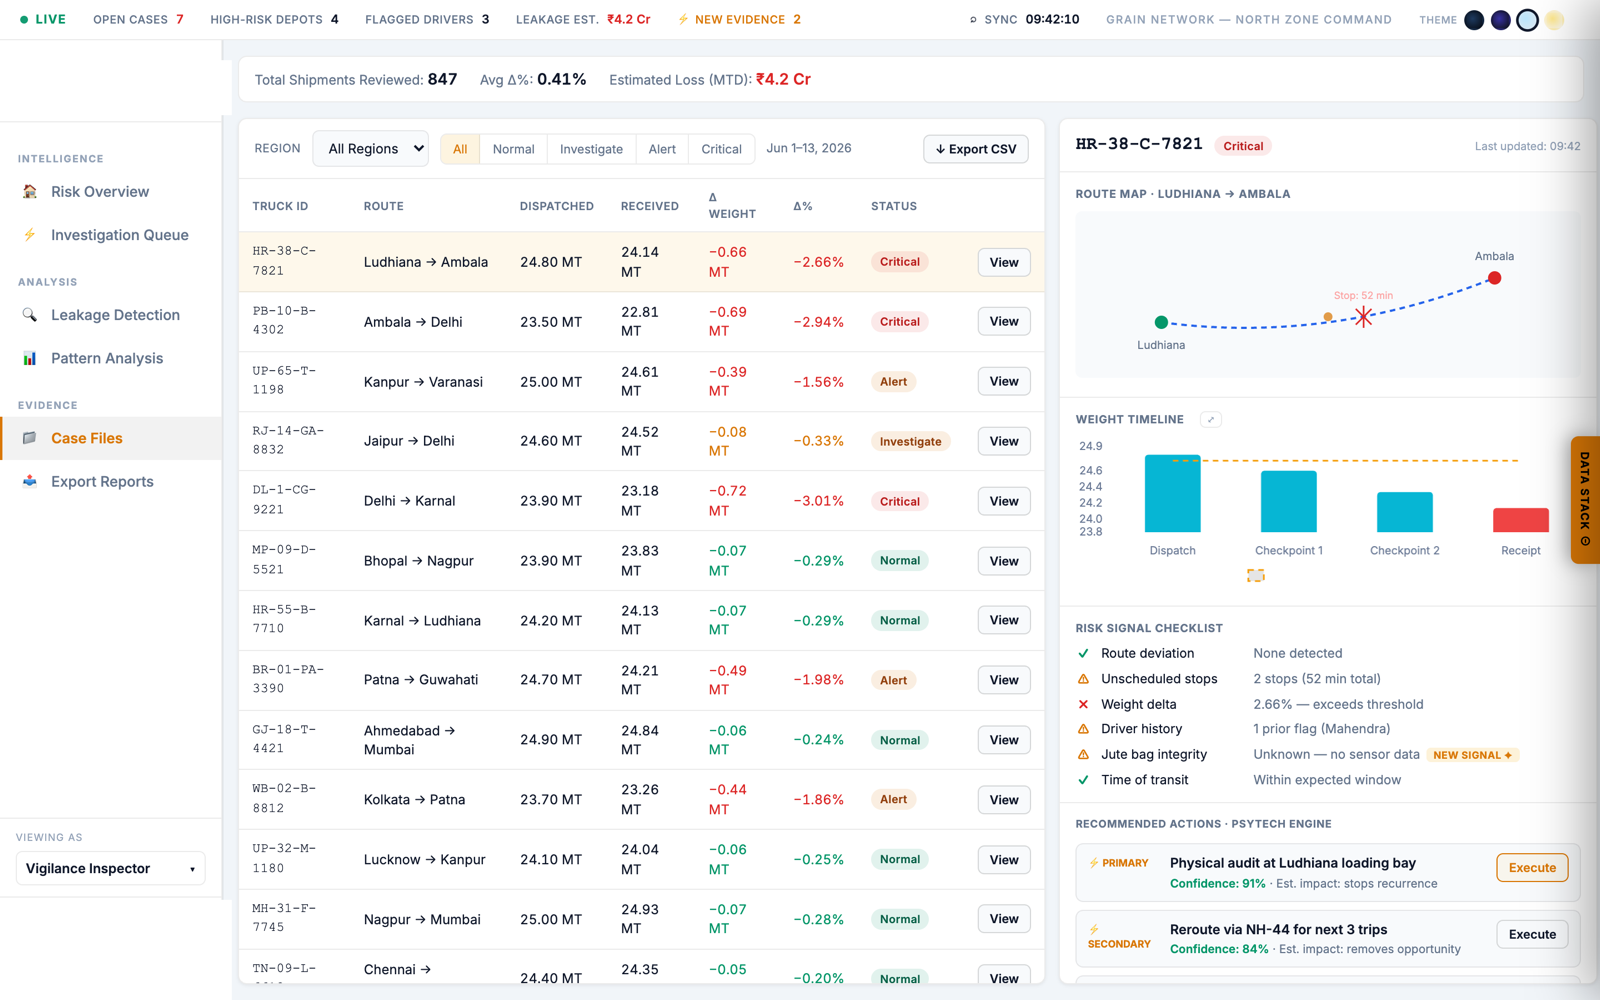
Foodgrain Supply Chain Monitoring Dashboard
Operations monitoring prototype
00:00
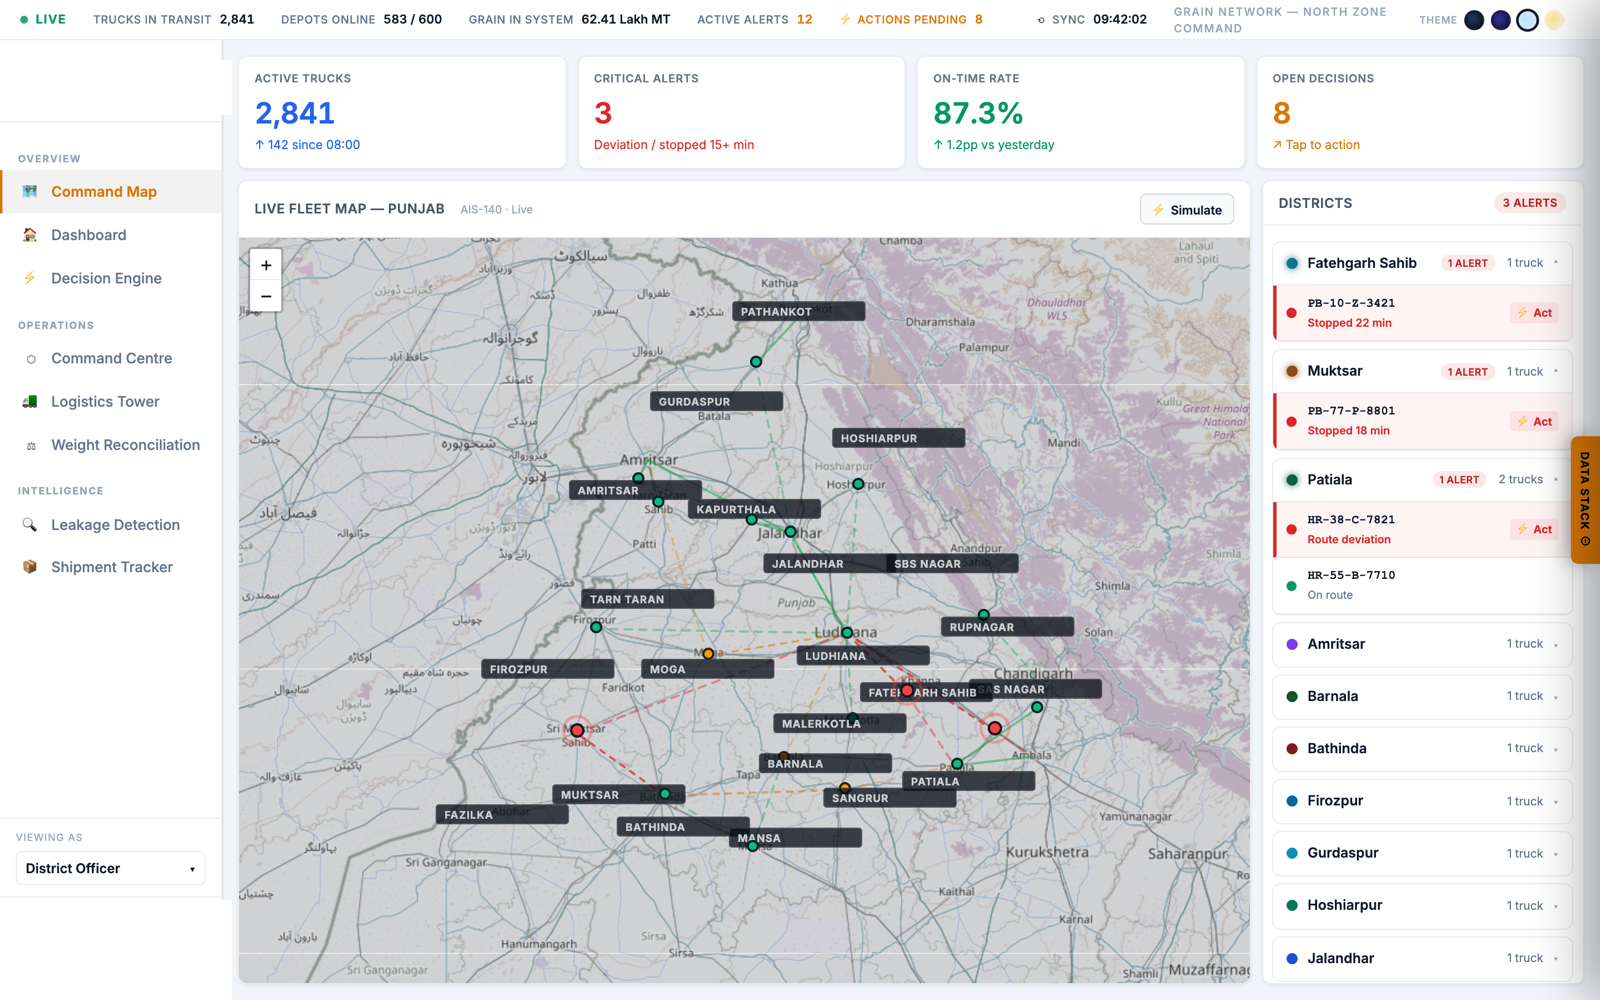
Onboarding → select District OfficerNational figures: 62.4L MT tracked, 2,841 trucks, ₹4.2 Cr leakage."This is the scale under monitoring — every truck, every depot, in one view."
01:30
Command CentreZone health grid, grain-flow pipeline, live alert feed."From procurement to beneficiary, this shows exactly where grain is at present."
03:30
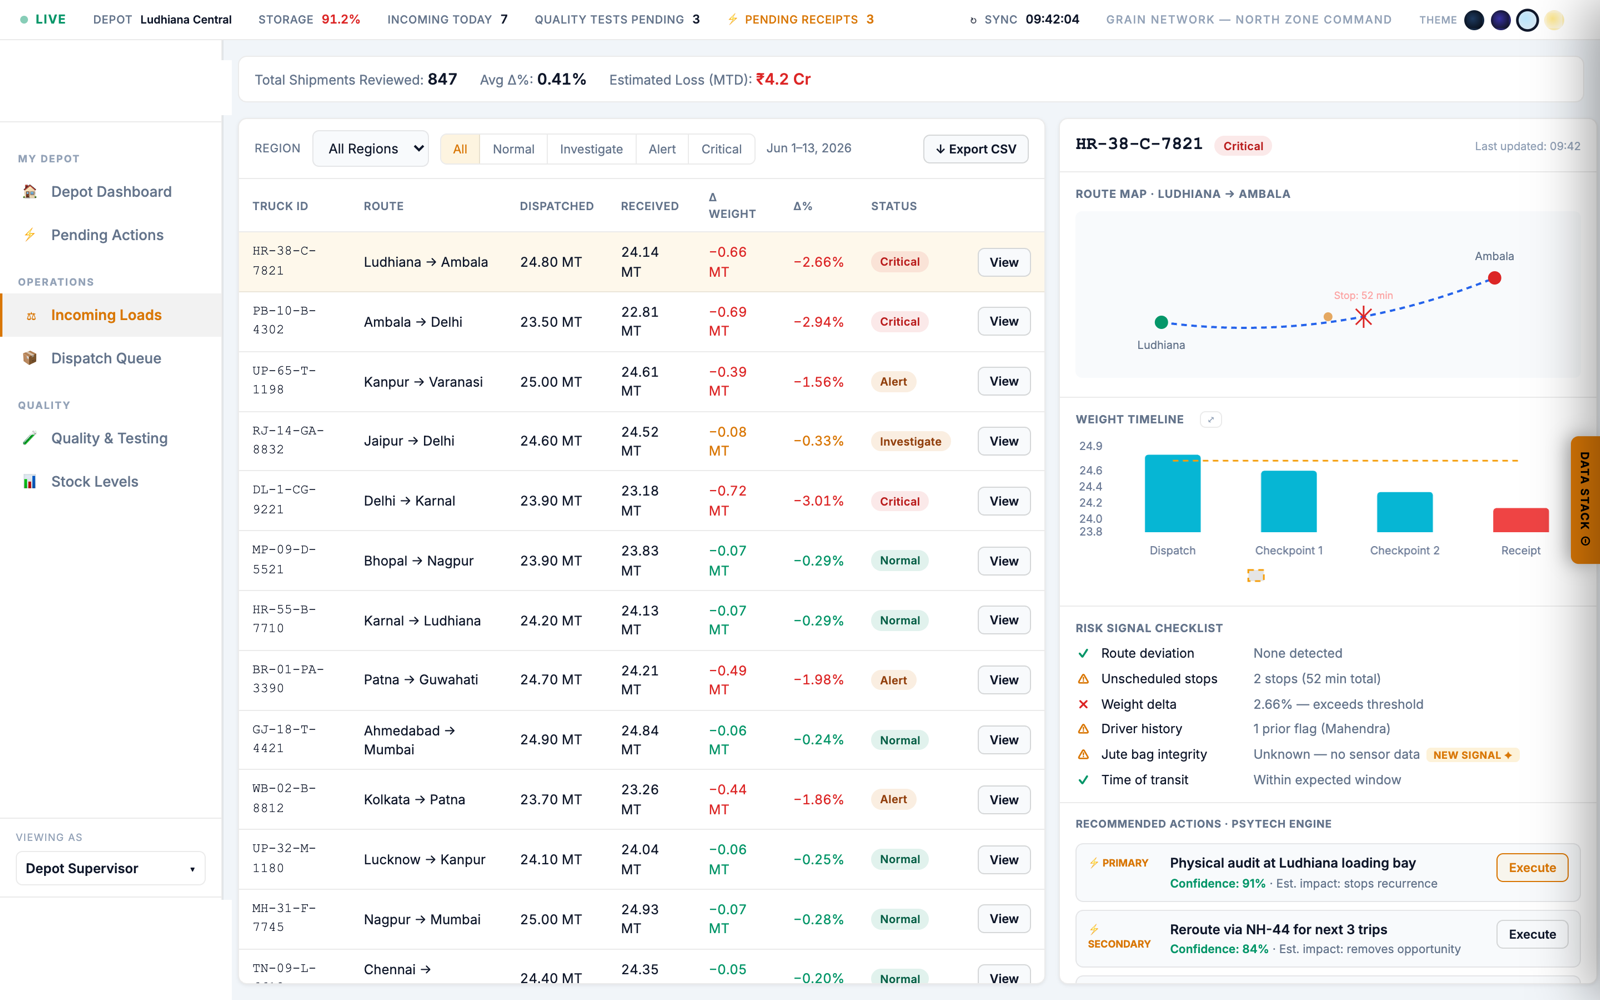
Switch role → Depot SupervisorShow weight/bag reconciliation on an incoming load."This is the point at which bag substitution or weight discrepancy is identified — at the point of receipt."
05:30
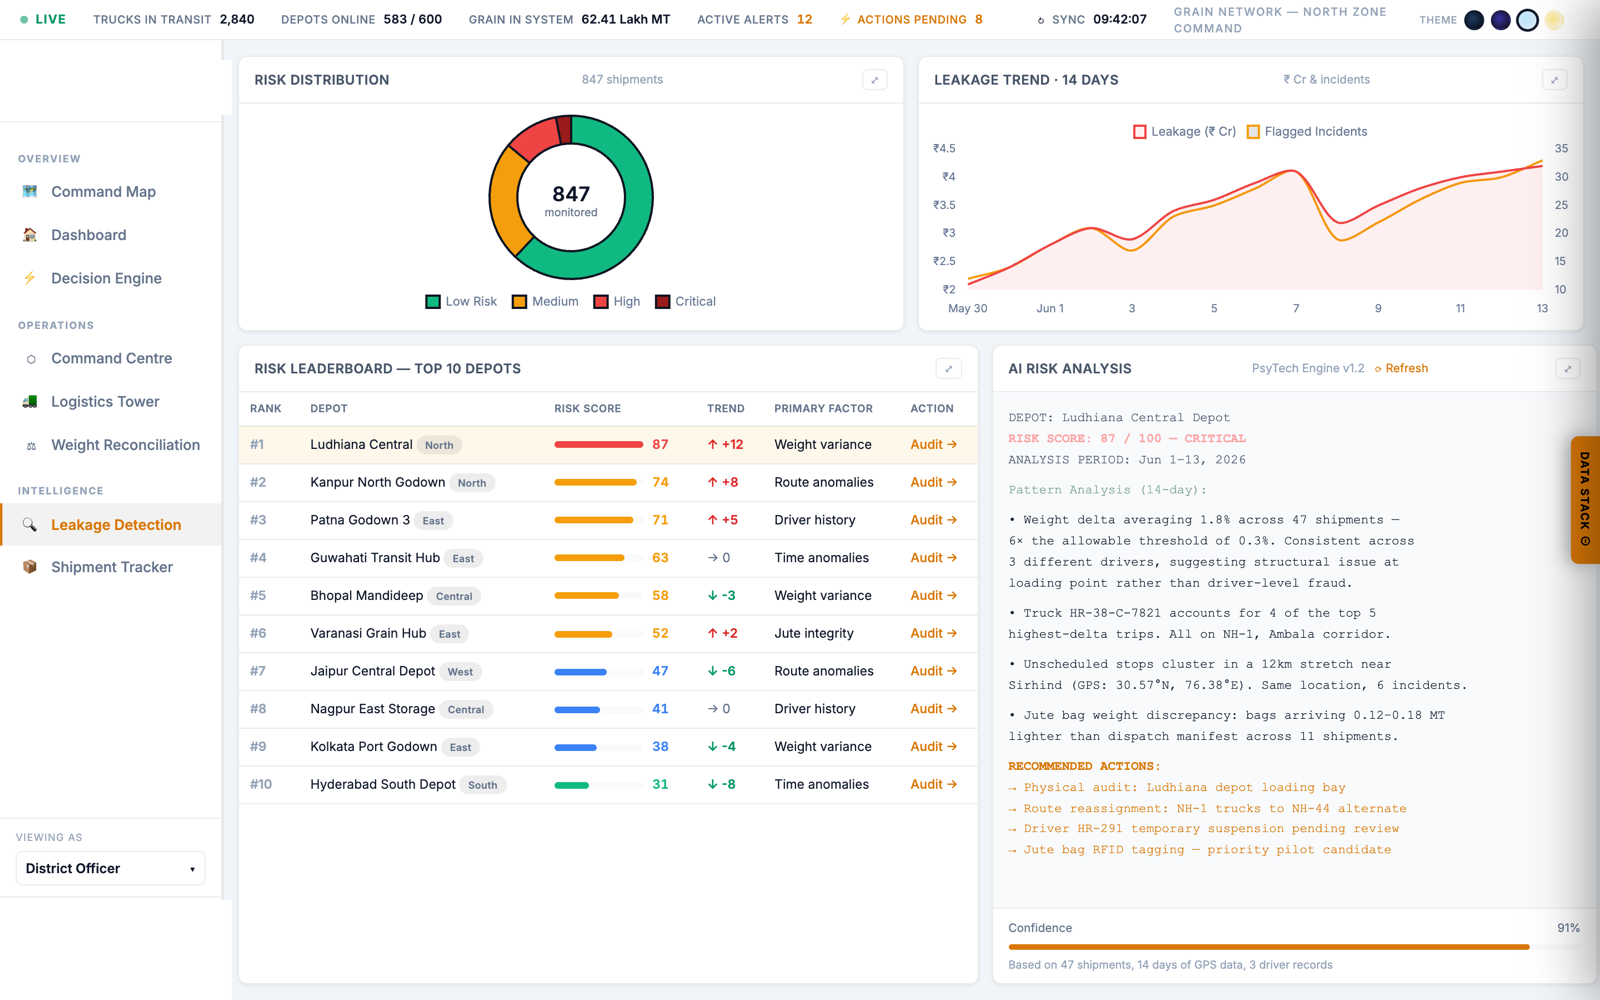
Leakage Detection moduleOpen the Weight Variance pattern card — ₹2.1 Cr, 88% confidence, 47 shipments."This is not a single flagged shipment — it is a recurring pattern across 47 shipments on one route."
07:30
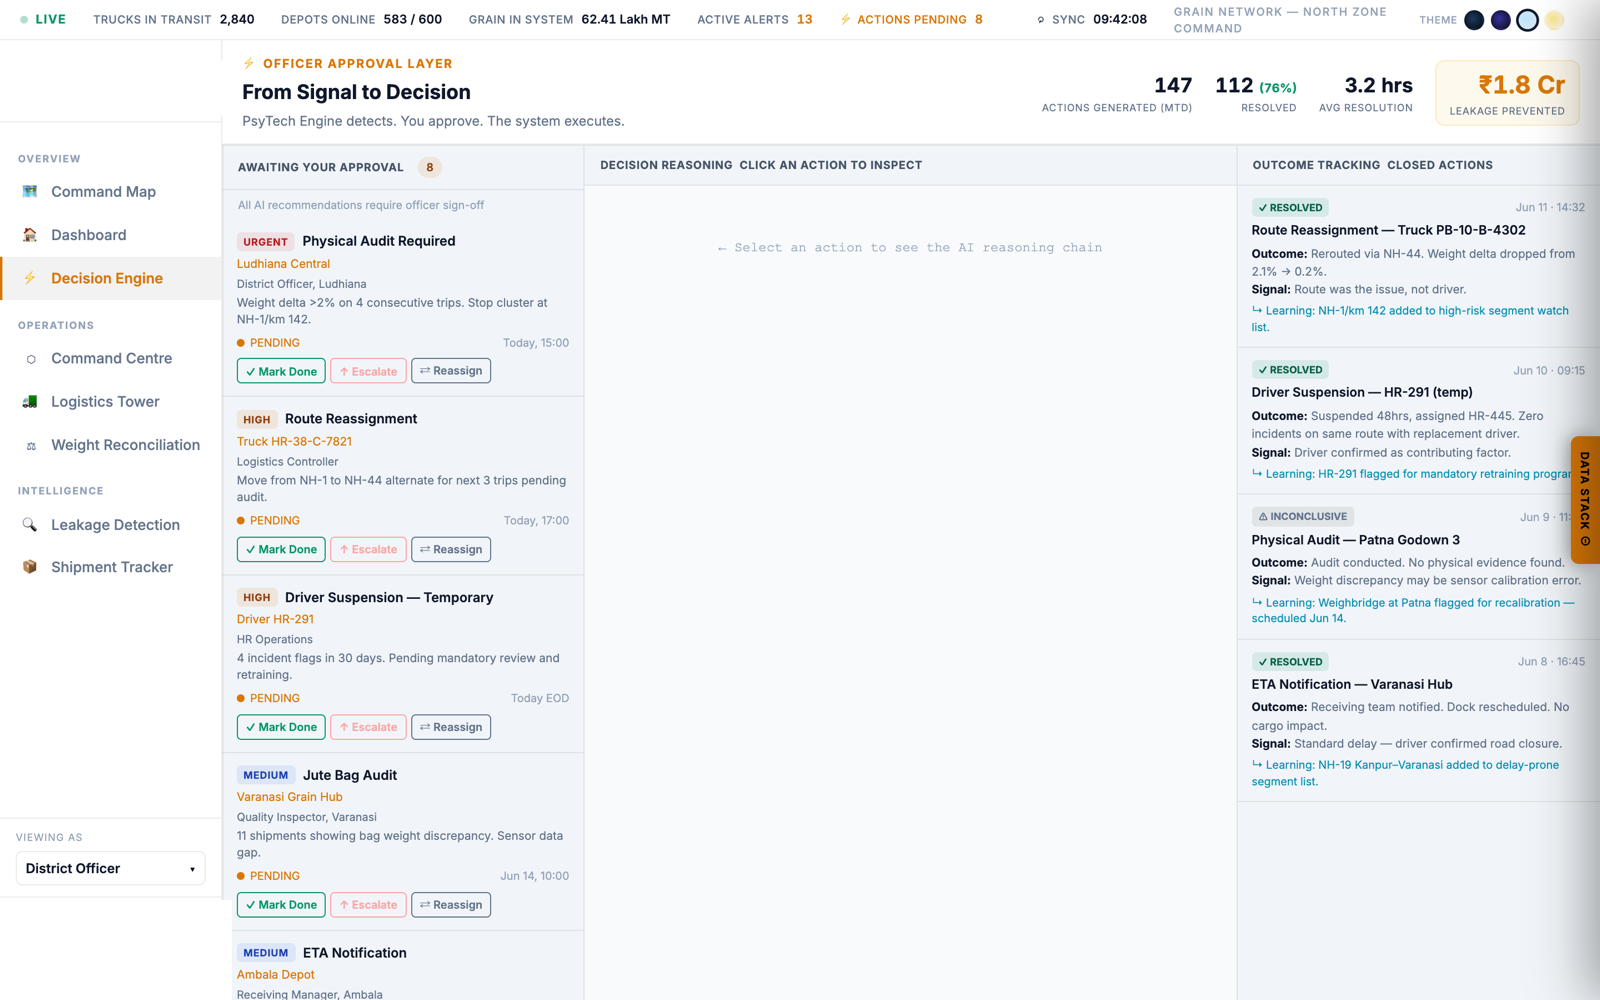
Decision EngineShow a recommended action with evidence and alternatives considered."The system recommends a course of action; an officer reviews and signs off before anything is executed."
09:30
Switch role → Vigilance InspectorOpen a case file — evidence chain, past case with FIR filed and ₹12L recovered."This is the record retained should a case proceed to enforcement."
11:00
CloseReturn to Command Centre."This is a working prototype — every screen shown can be examined further on request."
If connectivity is unavailable: the demonstration runs fully offline once the page has loaded — load it before entering the venue.
If asked whether this is live data: state clearly that the figures shown are illustrative, demonstrating how real data would be surfaced. Refer to the capability document for deployment requirements.