Food Corporation of India

A monitoring system for grain movement from procurement to distribution.

This document sets out the capabilities of a proposed operations-monitoring system for the Food Corporation of India, illustrated through a working prototype, together with an assessment of what would be required before deployment.

Consolidated tracking of grain in transit, automated reconciliation of weight and bag count at receipt, and pattern-based identification of recurring loss.
Prepared by PsyTech AI
System overview

Basis for the proposed system

Foodgrain moves in large volumes between procurement centres, storage depots and distribution points under the Corporation's supply chain. Given the scale and distances involved, gaining full visibility into transit conditions, weight variance and stoppages from manifest records alone can be difficult. The capabilities below are intended to add a layer of real-time visibility and analysis on top of the Corporation's existing operational framework.

01

Live tracking & geofencing

GPS/AIS-140 positions of the truck fleet on a live map, with alerts the moment a truck stops or deviates unexpectedly.

02

Weight & bag reconciliation

Declared vs. received weight and bag count logged automatically at every depot, with a seal-intact check to confirm shipment integrity at receipt.

03

AI risk scoring

Every shipment and route gets a confidence-scored risk profile built from pattern history, not a single rule triggering a single alert.

04

Leakage pattern detection

Surfaces recurring patterns that are easy to miss manually: geographic stop clusters, systematic weight variance on one route, jute-bag discrepancies, each with an estimated ₹ impact.

05

Decision engine with sign-off

Recommends the next action with its evidence and alternatives considered, so an officer can review and sign off before anything is actioned.

06

Vigilance case management

Flagged patterns become case files with a full evidence chain, tracked to closure, FIR filing, or amount recovered.

System overview

How the pieces connect

Data sources AIS-140 GPS feed Depot receipt records Weight & bag-count logs Route & manifest data Monitoring engine Weight/bag reconciliation Stop & route anomaly detection Recurring-pattern analysis ₹ impact estimation Confidence-scored flags Decision queue Evidence attached Recommended action Alternatives considered Estimated ₹ impact Officer decision Sign off or Refer to case
Figure 1. Data flow from source systems to a signed-off officer decision
Data sourcesAIS-140 GPS feed, depot receipt records, weight & bag-count logs, route and manifest data
Monitoring engineWeight/bag reconciliation, stop and route anomaly detection, recurring-pattern analysis, ₹ impact estimation
Decision queueEvidence attached: recommended action, alternatives considered, estimated ₹ impact
Officer decisionSign off, or refer to case
Prototype demonstration

Foodgrain Supply Chain Monitoring Dashboard

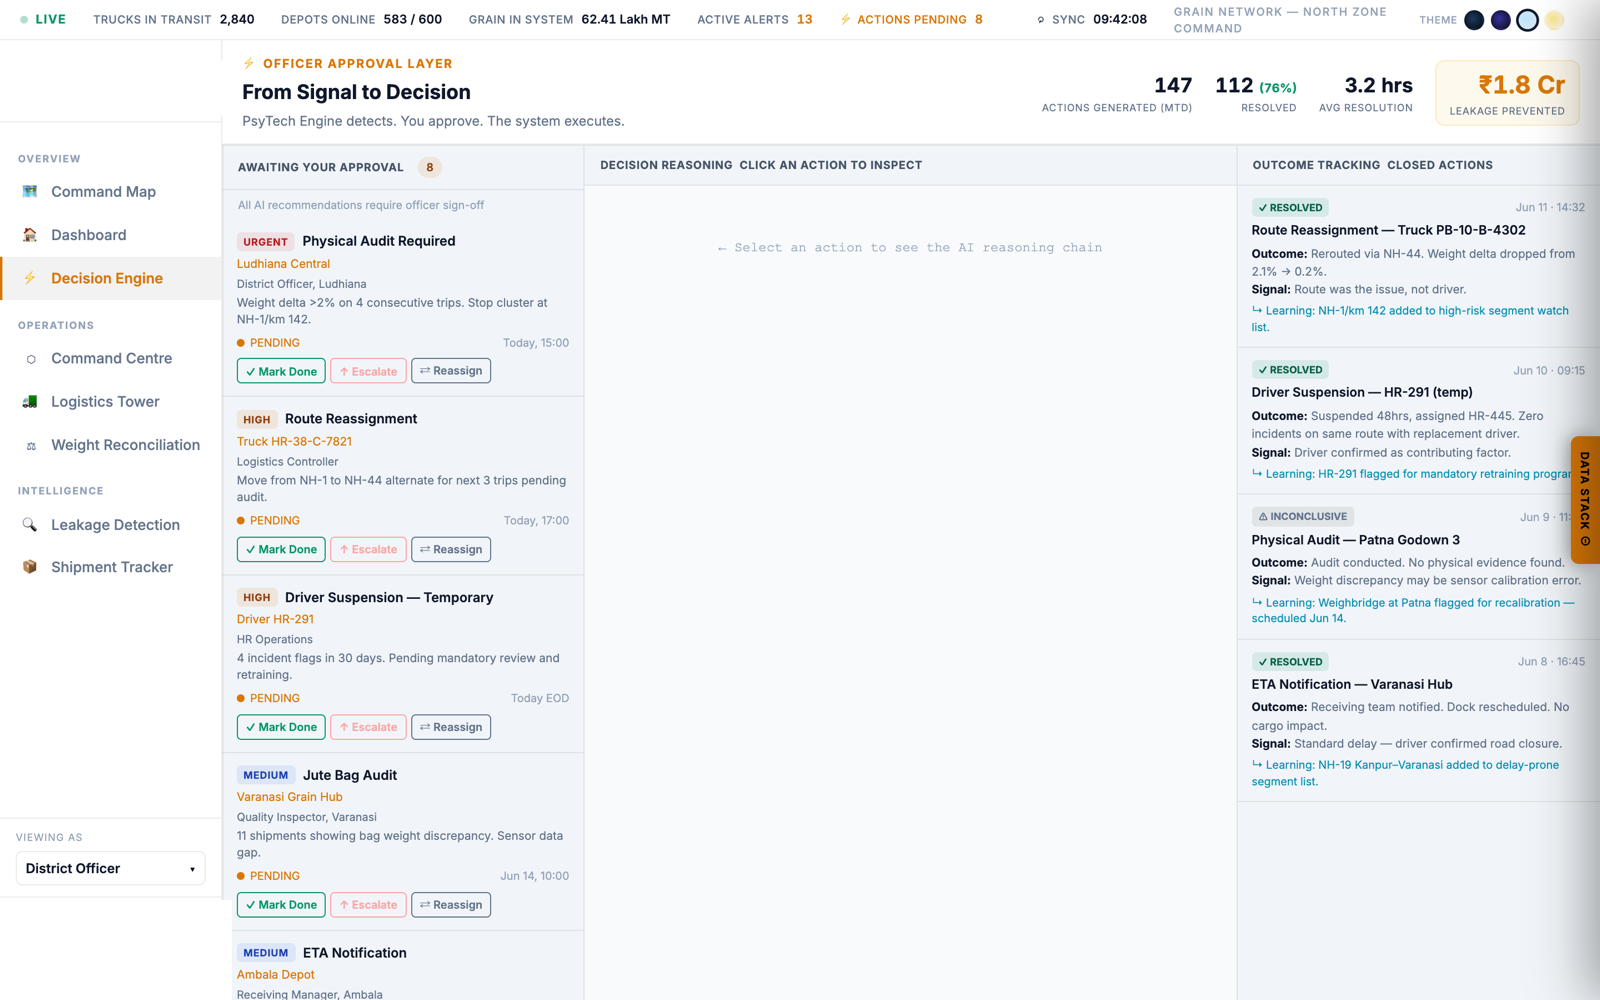
This is a functional prototype, not a static mockup: the screens described below are interactive and demonstrated in person, across four role-based views.
  • Command Centre: national zone health, grain-flow pipeline, live alert feed
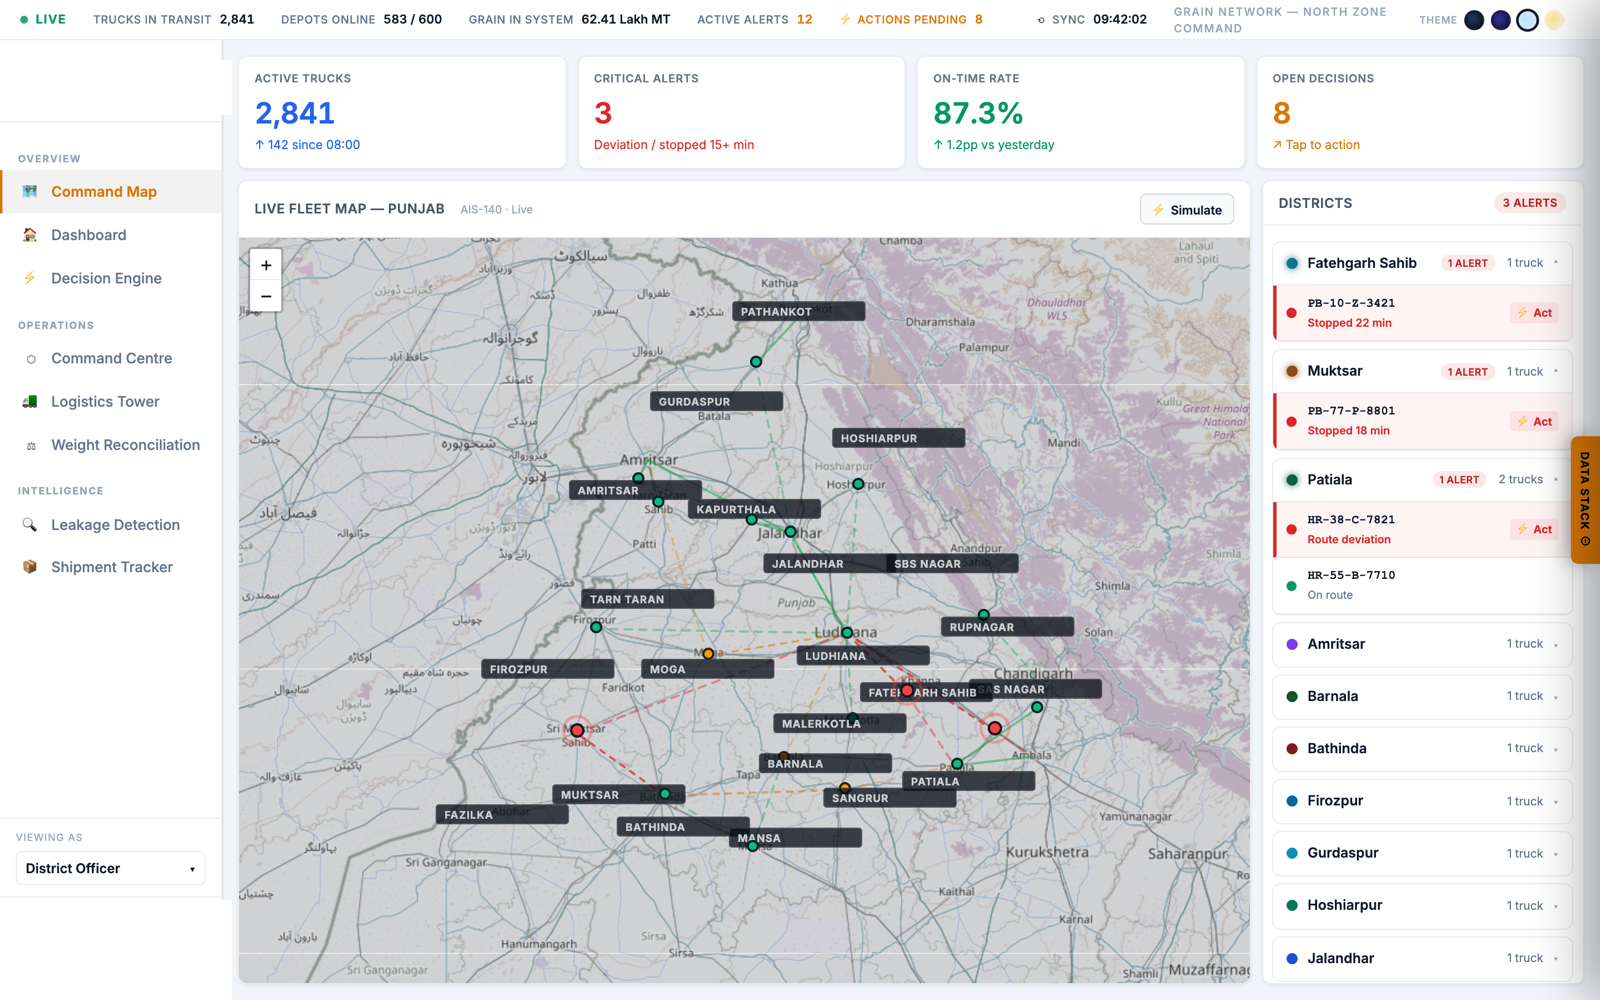
  • Logistics Tower: fleet map, shipment/weight/journey timelines, driver comms
  • Depot dashboard: incoming loads, storage %, weight & bag reconciliation
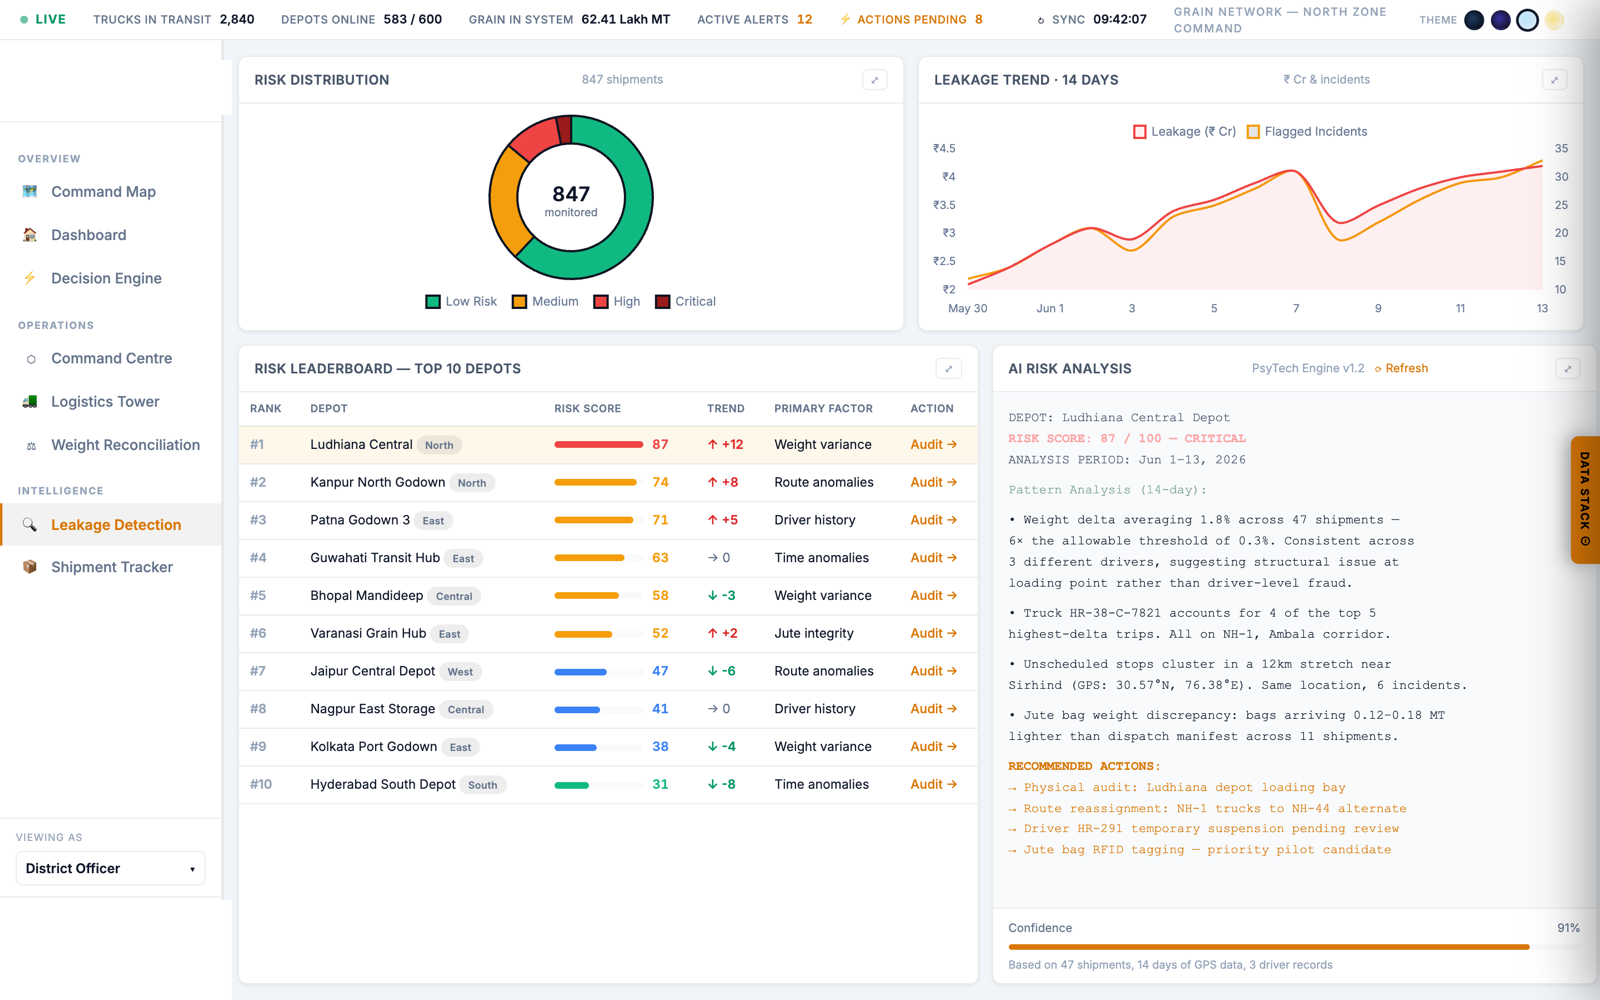
  • Leakage Detection: risk donut, top risk routes, pattern cards with ₹ estimate and confidence
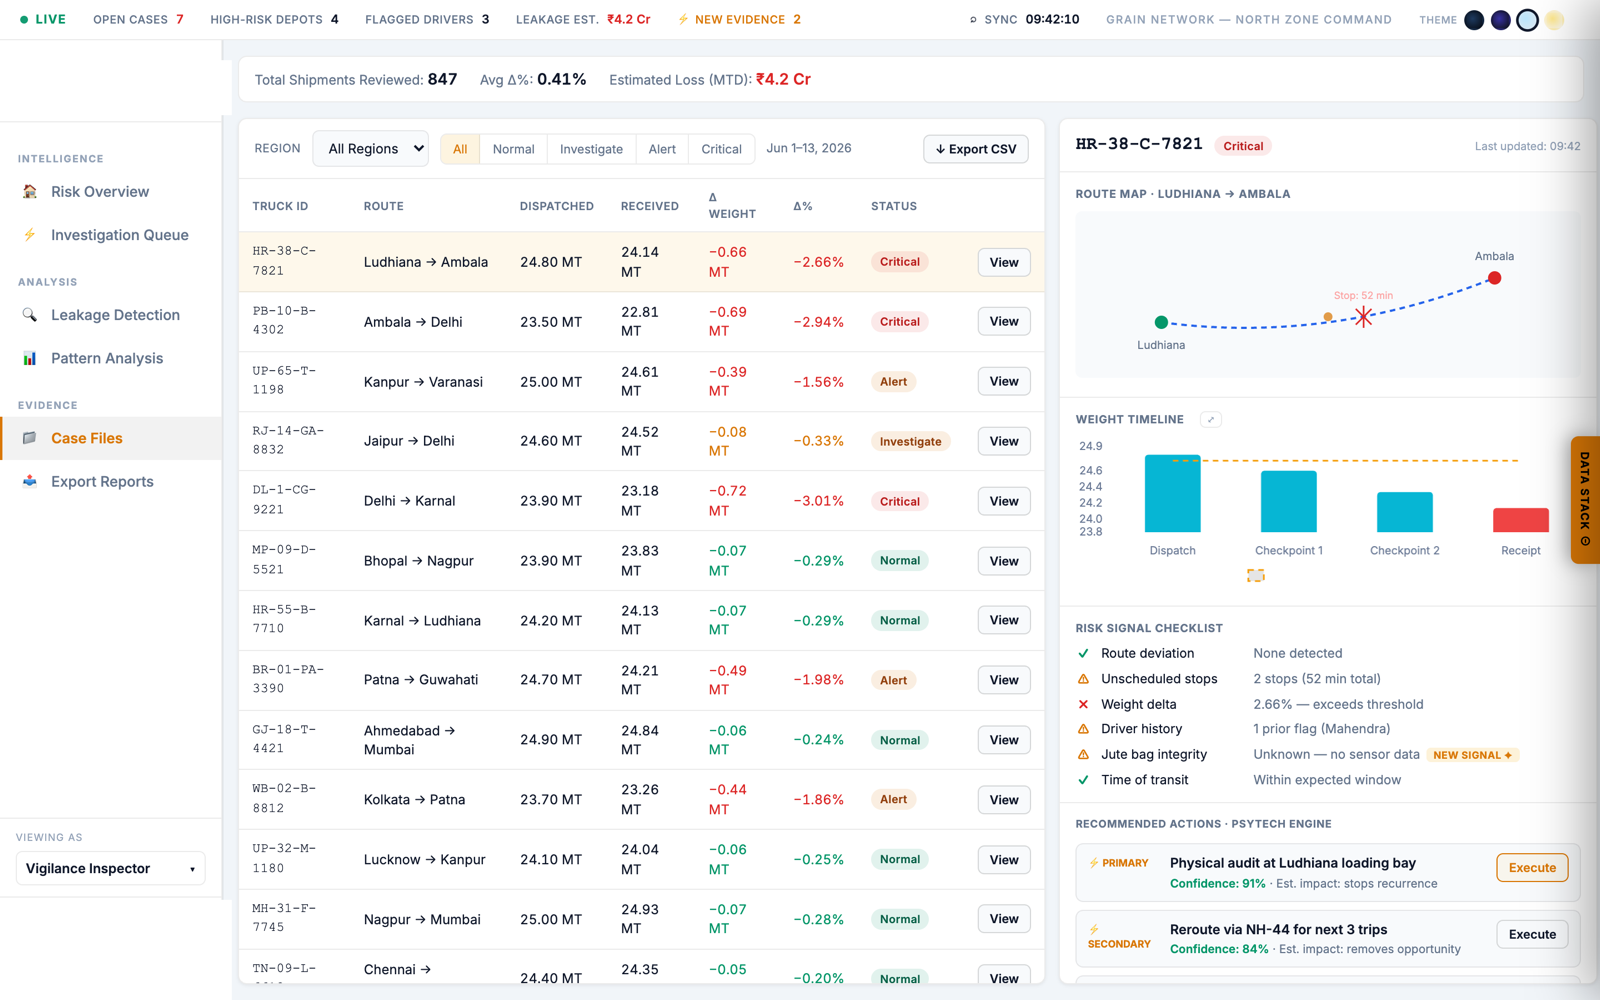
  • Vigilance case files: evidence chain, closure outcomes, FIR & recovery tracking
  • 4 role-based views: District Officer, Logistics Manager, Depot Supervisor, Vigilance Inspector
62.4L MTgrain tracked nationally
2,841trucks live on AIS-140 GPS
₹4.2 Crmonthly leakage addressed
76%AI actions resolved, MTD
₹1.8 Crleakage prevented, MTD
Prototype demonstration

Screens from the working prototype

Command Centre live fleet map
Command Centre: live fleet map, district alerts, network-wide status
Leakage Detection module
Leakage Detection: recurring loss patterns with confidence and ₹ estimate
Case handling workflow

From flagged pattern to officer decision

01 Shipments reconciled Declared vs. received weight and bag count logged at every receipt 02 Pattern surfaces Same route/lessee shows systematic variance across many shipments 03 Decision recommended Specific action with evidence and alternatives considered 04 Officer signs off Required before any action executes; unresolved cases route to Vigilance
Figure 2. Case lifecycle, weight-variance pattern example
01 · Shipments reconciledDeclared vs. received weight and bag count logged at every receipt
02 · Pattern surfacesSame route/lessee shows systematic variance across many shipments
03 · Decision recommendedSpecific action with evidence and alternatives considered
04 · Officer signs offRequired before any action executes; unresolved cases route to Vigilance
Decision Engine recommended action
Decision Engine: recommended action with supporting evidence, pending officer sign-off
Vigilance Inspector case view
Vigilance Inspector: case record with evidence chain and outcome tracking
Implementation status

Present state of the prototype and requirements for deployment

The prototype currently operates on illustrative data. Deployment for departmental use would require integration with the systems listed below.

CapabilityStatusWhat's needed for production
Command Centre, Logistics Tower, depot dashboard, case files, alert engineDemo-readyRe-skin with FCI branding; connect to an existing user directory for role/login.
Risk scoring & pattern detection logicTo buildModel tuned on historical shipment data; needs a data-sharing agreement.
Live GPS feed (AIS-140 / vehicle telematics)Needs integrationAPI access to the existing GPS/AIS-140 vendor or fleet telematics provider.
Panic button / IoT seal sensorsNeeds hardwareOnly where sensor hardware isn't already deployed on vehicles/depots.
Next steps

Demonstration

The dashboard is available for a full walkthrough, including role-based views, a flagged pattern, and the resulting officer decision.